|
|
|
![]() Click on button for Process Improvement Initiation Form
Click on button for Process Improvement Initiation Form
Process improvement is not a step by step process. Starting process improvement often results in learning more about area being looked at and its associated problems. This may result in realising that the approach is being taken is not going to be successful. When this happens, the reasons for predicted failure should be understood and agreed - reasons for failure can be inverted to become the reasons for success.
Process improvement requires the following:
Process improvement is not a matter of assigning blame to individuals or department but requires a wider focus which acknowledges that the performance of a system is dependant upon factors which include information quality and currency, operator training, tools, systems and time available to do the job. Most people want to do the best job possible and will if these factors are attended to. Process improvement is required when 'firefighting' happens too often. Click here for an example of how firefighting can become a 'rats nest' of issues.
ISO9000 fits into all this by providing a useful checklist for evaluating the quality system and prompting questions about how things are being done. It can be "vehicle for change" to a process improvement organisation and shoulld be applied as follows:
Process improvement requires people to be inspired, guided and coached rather than managed and directed. The techniques described below should be used in a spirit of learning from each other.
Purpose Using creative and lateral thinking, brainstorming uses the collective thinking power of a group of people to come up with a wide range of ideas. A good brainstorming session will produce scores of ideas. Click here for an example of ideas raised during a brainstorming session within a manufacturing operation. Similar issues may be seen in any organisation and although many of them may have already have been acknowledged, writing them down means that they can then be dealt with, for example in an action plan.
The main uses of brainstorming in process improvement are:
Two main methods can be used:
Flip chart
One person writes up on a flip chart all the ideas from the rest of the group.
Post it notes
Working in silence, over 10 minutes, all members of a brainstorming group write their ideas on post it notes using marker pens and capital letters. The same colour marker pens and post it notes are used by everyone and completed post it notes are stuck on the wall. During the 10 minutes, these post it notes accumulate and can be read by all. Any ideas can be written up - no criticism of them is allowed until the evaluation of ideas later. Reading a post it note will trigger new ideas. In practice, post it notes accumulate at an increasing rate which then reduces as ideas are exhausted.
The second method is, in my opinion, the best as the post it notes can then be grouped and arranged to construct a fishbone or cause and effect diagram . Whatever method is used, the result will be number of ideas which then need to be evaluated. If the post it note method is used, then these post it notes will then be grouped into clusters of associated ideas, for example men, methods, machinery, measurement, material, money classifications or who, what, when, where, why and how These classifications are also used in fishbone or cause and effect diagrams and process questioning . During this classification process, some duplication of ideas may be seen, and some ideas may be regarded as obvious non starters. When ideas are duplicated, then the amount of duplication indicates the consensus in the group. The final set of ideas can then be evaluated further using TPN analysis. When starting process improvement, it is worth remembering the slogan 'small steps quickly' i.e. don't try to do too much at once in case it cannot be completed.
When you make a successful improvement, make sure that you publicise it especially if this results in a significant time or cost saving.
A process applies people, materials, equipment, techniques, knowledge, time and money to produce a product or service to a customer (external or internal )
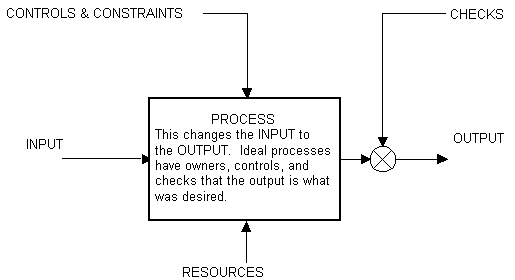
A process transforms an input to an output. A process consumes resources and operates under controls as shown in the diagram below:

Before any process can be improved it must have:
For process improvement to be possible, there needs to be a way of correcting the process operation and inputs to achieve the desired output
To understand the present situation, five key questions need to be identified:
Next, possible alternatives need to be identified. This is best done by brainstorming the following questions: ·
This last question is often overlooked !
The fishbone diagram is one technique for cause and effect analysis. To use it:
For the first step, we can use the matrix below to filter out the best ones.
| Idea or problem | Are all the required actions within our control ? | ||
| T otally | P artially | N ot at all | |
Any ideas whose implementation we don't have control over, we forget. If the group has partial influence, then it may be necessary to extend the group to include members who do have that control.
Options are evaluated on a scale of 1 - 5, with 5 being the best possible and 1 being no improvement.
|
Options
Criteria |
|
|
|
|
|
|
| Fit to business needs and strategy | ||||||
| Cost saving | ||||||
| Time reduction | ||||||
| Resources reduction | ||||||
| Ease of doing it | ||||||
| Customer Service Benefits | ||||||
| Quicker Response | ||||||
| Improved Internal Communications | ||||||
| Easier and more accurate information availability | ||||||
| Reduction in workload / duplication | ||||||
| Better use of employees skills and intelligence | ||||||
| Better support of sales | ||||||
| Risk of doing it | ||||||
| Risk of not doing it | ||||||
| Totals |
Step 3 is to agree who ownership of each action, recording this on an action plan

|
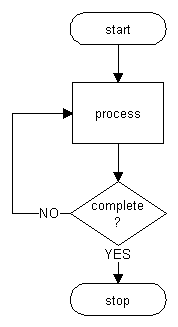
Block 1. What initiates the process, e.g. receipt of a purchase order for actioning.
Block 2. The work performed
Block 3. Verification that the work is complete. If not, then continue the process until complete
Block 4. End of process. Product passed on to next 'customer' |
Processes review should observe the following maxim: 'No process without measurement, no measurement without analysis, no analysis without action'
A Process Performance Measure defines what we intend to do to the process and has three parts:
Indicator of change or direction e.g. improve, increase, reduce e
Indicator of Quality the parameter to be monitored, measured or improved e.g. cost, time, number of rejects per batch
Transformation or process e.g. designing a network, processing purchase invoices, user training
Example:
Reduce the number of burnt biscuits per batch during cooking
PPM: The number of burnt biscuits per batch
The key questions are
When data is collected, it has to be presented in a format that makes it quick and easy to understand. There is an example of this in the section on Tally Charts. which uses a Pareto chart.
Tally charts are one of the simplest and most productive methods of data collection.
An example of using tally charts for evaluating customer satisfaction can be
seen by clicking on the chart
![]()
| Ref | Problem/Opportunity | Action Required | Action Owner | Target Date | Status |