|
|
|
Extract from MSc Thesis Implementing BS5750 within an Electronics Company September 1993. B. Hunt, University of Hertfordshire
Tally charts
A simpler technique was the use of tally charts. These are quick to use and interpret, giving a broader focus of analysis than frequency distribution curves. The analysis of these tally charts gave some interesting results: A file 'fault repair log' contained details of repairs made for each sub unit. In practice, these forms only held details of 'significant' faults but not those simple faults (e.g. solder shorts that were easily fixed with the tip of a soldering iron) that were found and rectified during testing or any faults found on OEM supplied units as these were not repaired by XXX Co. but were returned to the supplier under warranty. Generally, circuit boards or sub units with significant faults were put to one side until the rest of the test batch was processed. Using the tally charts meant that both simple and significant faults were recorded with significant faults also entered in the repair log. Consequently, the number of documented faults increased to match the number of faults identified. In the case of one circuit board, a sample of twelve tested on one day gave the same number of faults as documented in the previous eight months.
An analysis of failure modes showed that faults fell into three main categories: a) manufacturing assembly errors, b) early life component failures and c) performance failures when a circuit board was tested as part of a complete system.
The example pareto chart below shows the breakdown of fault types from one vendor. This information is now fed back to the subcontractor to enable him to improve the quality of his production process.
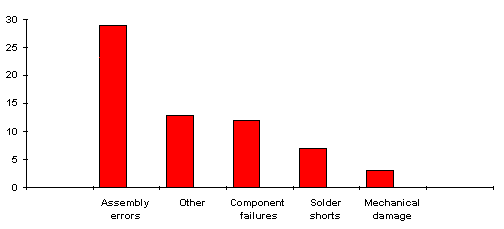
Fig 8: Pareto chart showing fault breakdown of circuit board failures